

Cryptocurrencies have a reputation for steep price movements, many of which defy logical explanations. For instance, even diehard Dogecoin (DOGE) fans didn't imagine the Shiba Inu-themed coin rising from a market cap of $1 billion to $89 billion within a few months in 2021 (although it fell later on).
While navigating the swirling crypto currents is tough, traders have a few tools in their arsenal to visualize the most likely scenarios. In fact, an entire field of research called technical analysis is dedicated to assessing crypto price patterns and forecasting day-to-day possibilities.
Although crypto technical analysis is subject to interpretation, it can be a beneficial strategy when researching coins or tokens and trading positions. And if you’re a newbie learning crypto trading, reviewing how technical analysis works, along with some of the most popular technical indicators in the crypto market, will help you make more informed decisions.
What is Technical Analysis in Crypto?
Crypto technical analysis is a set of techniques and tools traders use to decipher price data in cryptocurrency charts. Instead of focusing on a cryptocurrency's fundamental metrics like its use case, underlying technology, or growth projections, a technical analyst looks into how a digital asset's price performed in the past.
Traders also use technical crypto indicators to attempt to spot visual patterns, trends, or abnormal activity in a crypto chart to predict future price moves. It's also common for traders to use technical analysis to point out attractive price targets for buying or selling a crypto asset from a historical perspective.
Why do Crypto Traders Use Technical Analysis?
Scanning crypto price charts may seem as dubious as peering into tea leaves to predict the future, but technical analysts believe there's a strong correlation between past price performance and future probabilities––just like how we say “history repeats itself.”
While guaranteeing a future result is impossible, using technical indicators gives traders more data to consider when evaluating their trading strategy's odds of success. Once traders identify significant price levels in a crypto asset's chart, they may find it easier to assess the risk of their positions and prepare for worst-case scenarios. Researching chart patterns and critical price levels beforehand gives traders concrete numbers when determining how much they want to profit from a trade and how much they're fine losing.
For instance, traders sometimes set stop-loss or sell limit orders at significant price levels to automatically close positions if a trade moves too far in an unfavorable direction. At the same time, some traders set take-profit orders to immediately close a winning position at a particular price. Setting these orders ahead of time helps manage market volatility and can take a lot of stress out of crypto trading.
Reading Crypto Charts: The Basic Blueprint
There are two varieties of cryptocurrency price charts: line and candlestick.
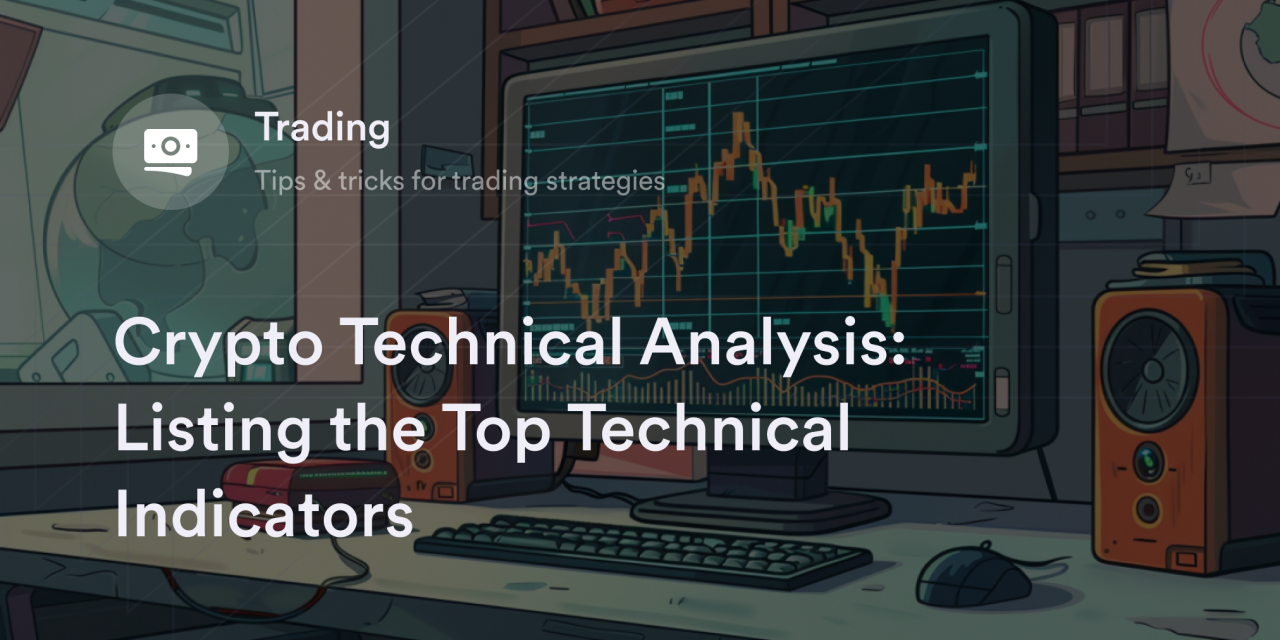
While a line chart shows a crypto asset’s median price over time, represented by a zigzagging line, a candlestick chart shows the price movements for crypto assets using vertical rectangles. Of these charting styles, technical analysts often prefer candlestick patterns because they provide more detailed information on price action. Within each candlestick, traders see the complete picture of a cryptocurrency's price fluctuations within a given time frame. For instance, in a daily Ethereum (ETH) candlestick chart, each candlestick represents 24 hours of price movement for ETH. Many technical charting tools make it easy to change the time per candle to hourly, weekly, or monthly for more pricing information.
Whichever time frame you choose, the method for interpreting each candlestick is the same. You’ll have to look at the candlestick's color to determine if the price went up or down at the session's close. Green candles mean the price for the cryptocurrency closed at the top of the rectangle, while red means it ended at the bottom. The straight lines on the ends of each candlestick (aka wicks) show the furthest price a cryptocurrency traded but not where it closed. The longer the wicks are on candlesticks, the more likely there's heightened price volatility for a cryptocurrency.
What are Common Technical Indicators?
To glean more insights from a cryptocurrency's candlestick chart, traders use dozens of software programs, indicators, and tools. Everyone has a personal strategy when scanning price charts, but a few tools have become staples in many technical analysts’ toolkits:
Moving Averages (MAs)
An MA is a line tracking the median price of a cryptocurrency over a set period of days. For example, the 100-day MA plots the average cost for a digital asset using the prior 100 days of trading data. Traders use MAs to visualize the trend for a cryptocurrency and find attractive entry or exit points. For example, if Bitcoin (BTC) is above most MAs, it may signal BTC is in a bullish uptrend, so traders feel more comfortable buying price dips.
Volume Charts
Volume measures how many people exchanged a cryptocurrency within a given time frame, which often correlates with a digital asset's price volatility. When more people buy or sell a cryptocurrency than the average (i.e., when the volume is high), there's a greater chance of wild price swings. Typically, volume bars are on the bottom of candlestick charts, and traders use them to gauge the current and historical interest in a digital currency.
Relative Strength Index (RSI)
The RSI is a number between 0 and 100, measuring the average gains divided by the average losses for cryptocurrency traders. Traders often use RSI scores to predict whether a crypto asset is overbought or oversold and whether it's likely to see a trend reversal. For instance, if the RSI approaches 100 as Ethereum's price skyrockets, it suggests ETH's price is getting overheated and is due for a pullback.
Bollinger Bands
Named after financial author John Bollinger, Bollinger bands are a set of three lines using a statistical measure called a standard deviation to guess the average trading range for crypto assets. While the middle line is a moving average, the other two lines are standard deviations above and below the cryptocurrency's median price. Typically, 95% of the trading activity for a crypto asset occurs between the outer Bollinger bands, making it easy for traders to visualize the expected price range for a cryptocurrency.
Fibonacci Retracements
From stars to sunflowers, there's a remarkable symmetry in natural shapes matching a magical set of numbers called Fibonacci retracements (i.e., 23.6%, 38.2%, 50%, 61.8%, and 100%). Some traders believe these Fibonacci retracements also play out in the crypto markets and often plot these percentages on top of current price levels to see potential future targets.
Are There Drawbacks to Using Crypto Technical Analysis?
Technical indicators are beneficial tools in crypto trading, but traders must remember past price data is not indicative of future results. Using technical chart patterns doesn't account for many other significant factors influencing the crypto market, including sentiment, news, or fundamental changes to a cryptocurrency's protocol. Unforeseen events or developments may also impact price performance, which a detailed chart study can't catch. For this reason, many crypto traders use technical analysis as a part of their overall strategy rather than solely relying on these indicators.
Also, crypto technical analysis isn't ideal for people interested in holding (aka HODLing) cryptocurrency for a long time. Although using technical charts helps identify attractive near-term prices to buy crypto assets, this data is most relevant for short-duration traders. Because technical analysis focuses so heavily on pinpointing precise prices, it can be useful for traders who need to set their buy and sell orders for quick moves.
Eligible Traders can Set Their Crypto Trading Strategy on dYdX
dYdX makes it easy for eligible crypto perpetuals traders to set their technical trading strategies on our decentralized exchange.
With features such as slippage tolerance control and multiple order categories, eligible traders get the flexibility to enter and exit their derivatives positions at their preferred levels. Check out dYdX's blog for more details on the latest upgrades and tools on our trading platform.
Also, don't forget our in-house resource library, dYdX Academy, has dozens of easy-to-read guides and educational pieces on crypto trading techniques.
Eligible traders can start trading on dYdX today!
Disclaimer
The content of this article (the “Article”) is provided for general informational purposes only. Reference to any specific strategy, technique, product, service, or entity does not constitute an endorsement or recommendation by dYdX Trading Inc., or any affiliate, agent, or representative thereof (“dYdX”). Use of strategies, techniques, products or services referenced in this Article may involve material risks, including the risk of financial losses arising from the volatility, operational loss, or nonconsensual liquidation of digital assets. The content of this Article does not constitute, and should not be considered, construed, or relied upon as, financial advice, legal advice, tax advice, investment advice, or advice of any other nature; and the content of this Article is not an offer, solicitation or call to action to make any investment, or purchase any crypto asset, of any kind. dYdX makes no representation, assurance or guarantee as to the accuracy, completeness, timeliness, suitability, or validity of any information in this Article or any third-party website that may be linked to it. You are solely responsible for conducting independent research, performing due diligence, and/or seeking advice from a professional advisor prior to taking any financial, tax, legal, or investment action.
You may only use the dYdX Services in compliance with the dYdX Terms of Use available here, including the geographic restrictions therein.
Any applicable sponsorship in connection with this Article will be disclosed, and any reference to a sponsor in this Article is for disclosure purposes, or informational in nature, and in any event is not a call to action to make an investment, acquire a service or product, or purchase crypto assets. This Article does not offer the purchase or sale of any financial instruments or related services.
By accessing this Article and taking any action in connection with the information contained in this Article, you agree that dYdX is not responsible, directly or indirectly, for any errors, omissions, or delays related to this Article, or any damage, injury, or loss incurred in connection with use of or reliance on the content of this Article, including any specific strategy, technique, product, service, or entity that may be referenced in the Article.


