

Crypto traders often rely on a combination of technical indicators and astute assessment skills to forecast market movements. In this context, the bear flag pattern emerges as a pivotal tool, a key indicator that helps traders predict the continuation of a downward trend.
In this guide, we'll discuss what a bearish flag pattern is, how to trade crypto during bear markets, and the pros and cons of bear flag patterns. We’ll also discern the differences between bear and bull flags.
What is a bear flag pattern?
The bear flag candlestick pattern is a continuation pattern, meaning that after the pattern is completed, prices typically move in the same direction as before the pattern appeared—downward. This pattern tends to form over days to weeks, with traders often entering short positions soon after the downward breakout.
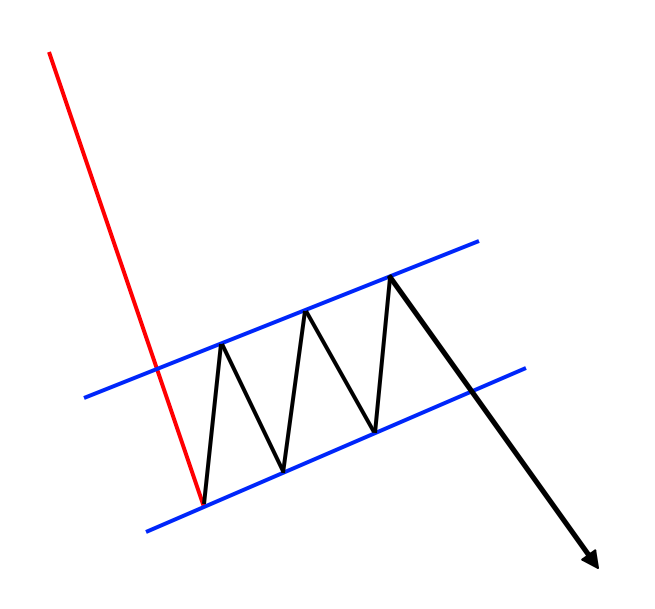
Traders can rely on three fundamental elements to identify a chart as a bear flag.
Flagpole: The pole is formed by a sharp and significant price drop. This steep decline indicates strong selling pressure and sets the stage for the flag’s formation. It represents a rapid shift in market sentiment towards the bearish side.
Flag: Following the pole, the flag is a short period of consolidation. This phase is characterized by smaller price movements and typically takes a slight upward or sideways trajectory. The flag represents a temporary slowdown in downward momentum, where the market appears to be taking a brief pause.
Breakout: The final element is the breakout, which occurs when the price breaks below the lower trend line of the flag pattern. This breakout signifies a continuation of the initial bearish trend and often leads to further declines in price. Traders watch this breakout carefully as it confirms the bear flag pattern and may signal a good opportunity to enter a short position.

Traders can also use momentum indicator relative strength index (RSI) to confirm a bear flag. An RSI declining to levels below 30 going into the flag can be a good sign that the downtrend is strong enough to activate the pattern successfully.
How to trade crypto with a bear flag pattern
Trading crypto with a bear flag chart pattern involves recognizing this formation and implementing strategies that capitalize on the anticipated continuation of the downward trend. Here's a guide to different trading strategies used during a bear flag pattern:
Short selling
Traders should consider entering a short position during a bear flag pattern. This means selling a cryptocurrency with the expectation that its price will continue to fall, allowing them to buy back at a lower price.
The ideal entry point for a short position is typically just after the price breaks below the lower boundary of the flag.
Setting stop losses
To manage risk, setting a stop-loss order above the flag’s upper boundary is crucial. This limits potential losses if the price unexpectedly reverses and starts to rise. The order should be set at a level that allows some flexibility for price movement but not so high that it negates the potential profit from the trade.
Profit targets
Profit targets are essential for a disciplined trading approach. Traders often set a target based on the flagpole’s height.
Confirming with volume
Monitoring trading volume can provide additional confirmation. A valid bearish flag pattern often has high volume during the pole's formation and lower volume during the flag's formation. A subsequent increase in volume at the breakout point can confirm the pattern's strength and trend continuation.
Combining with other indicators
Traders often combine the bear flag pattern with other technical indicators like moving averages, RSI, or moving average convergence divergence (MACD). These indicators help confirm the bearish trend and provide additional insights into market momentum and potential reversal points.
Some traders also use Fibonacci retracement to confirm the pattern and gauge the downtrend’s strength; usually, the flag shouldn't exceed the flagpole’s 50% Fibonacci retracement. When predicting the downtrend’s strength, a shorter flag indicates a stronger downtrend and breakout. The retracement will end at roughly 38.2% in a textbook example of a bear flag, meaning the brief move upward doesn’t recover much lost ground before heading lower again.
Pros and cons of the bear flag pattern
The bear flag pattern, while a popular tool among traders, comes with its own set of advantages and disadvantages. Understanding these can help traders make more informed decisions when using this pattern in their trading strategies.
Pros
Predictive clarity: The bear flag pattern indicates a continuing downtrend, helping traders anticipate and prepare for further price declines.
Structured approach: It offers structured entry and exit points. The breakout from the flag's lower boundary serves as an entry point for a short position, while a stop-loss can be placed above the flag's upper boundary, providing a disciplined trading approach.
Versatility across time frames: Traders can identify the pattern in various time frames, from short-term intraday charts to long-term historical data, making it versatile for different trading styles.
Volume confirmation: The pattern is often accompanied by specific volume trends, adding an extra layer of confirmation for traders.
Cons
False breakouts: The pattern can sometimes lead to false breakouts, where the price doesn't continue to drop as expected, potentially leading to losses.
High market volatility: Crypto markets are known for their high volatility, which can sometimes disrupt the formation of the pattern or lead to rapid, unexpected reversals.
Need for supplementary analysis: Relying solely on the bear flag pattern can be risky. Experts often advise traders to use additional indicators to confirm the pattern and strengthen their trading strategies.
Timing challenges: Identifying the perfect moment to enter or exit a trade based on the bear flag pattern can be challenging, especially in the fast-moving crypto market, where delays can significantly impact the trade's outcome.
Bear flag versus bull flag: Key differences
A bull flag is a bear flag’s inversion, where the flagpole is an upward trending line, the flag is a temporary downward consolidation, and prices ultimately break out into the uptrend. But that’s not the only difference. Here’s how bear and bull flags differ:
Pattern appearance
Bear flags are characterized by a steep decline in price, followed by a consolidating, slightly upward, or sideways pattern. Bull flags, conversely, are identified by a sharp increase in price, followed by a downward or sideways consolidation phase.
Expectation after pattern completion
Bear flags predict a continuation of the bearish trend, with prices expected to break below the flag’s lower boundary. Bull flags, on the other hand, suggest a resumption of the bullish trend, with prices anticipated to break above the flag’s upper boundary.
Volume trend
Bear flags typically show high trading volume during the pole's formation and lower volume during the flag phase, with an increase in volume at the breakout point downward. While bull flags also display high volume during the pole formation and reduced volume during the flag, it’s with an increase in volume during the upward breakout.
Trading strategy
During a bearish market sentiment, traders might consider short selling at the breakout below the flag or exiting long positions in anticipation of a continued price drop. However, during bullish conditions, traders often look to enter long positions or buy at the breakout above the flag, expecting further price increases.
Learn more crypto trading tips with dYdX Academy
Eligible traders looking to excel at crypto trading can check out dYdX Academy, our in-house education hub that includes guides on topics like trading algorithms, spot trading, and cryptojacking.
dYdX also offers eligible traders a premier decentralized exchange to trade crypto perpetuals with up to 20x leverage, deep liquidity, and low fees. Head to our official blog to know more about our platform and products, and eligible traders can start trading on dYdX today.
Disclosures
The content of this article (the “Article”) is provided for general informational purposes only. Reference to any specific strategy, technique, product, service, or entity does not constitute an endorsement or recommendation by dYdX Trading Inc., or any affiliate, agent, or representative thereof (“dYdX”). Use of strategies, techniques, products or services referenced in this Article may involve material risks, including the risk of financial losses arising from the volatility, operational loss, or nonconsensual liquidation of digital assets. The content of this Article does not constitute, and should not be considered, construed, or relied upon as, financial advice, legal advice, tax advice, investment advice, or advice of any other nature; and the content of this Article is not an offer, solicitation or call to action to make any investment, or purchase any crypto asset, of any kind. dYdX makes no representation, assurance or guarantee as to the accuracy, completeness, timeliness, suitability, or validity of any information in this Article or any third-party website that may be linked to it. You are solely responsible for conducting independent research, performing due diligence, and/or seeking advice from a professional advisor prior to taking any financial, tax, legal, or investment action.
You may only use the dYdX Services in compliance with the dYdX Terms of Use available here, including the geographic restrictions therein.
Any applicable sponsorship in connection with this Article will be disclosed, and any reference to a sponsor in this Article is for disclosure purposes, or informational in nature, and in any event is not a call to action to make an investment, acquire a service or product, or purchase crypto assets. This Article does not offer the purchase or sale of any financial instruments or related services.
By accessing this Article and taking any action in connection with the information contained in this Article, you agree that dYdX is not responsible, directly or indirectly, for any errors, omissions, or delays related to this Article, or any damage, injury, or loss incurred in connection with use of or reliance on the content of this Article, including any specific strategy, technique, product, service, or entity that may be referenced in the Article.


