

Picture this: You’ve purchased one Bitcoin (BTC), which has been on the rise three times in a row. However, your excitement often turns to dismay as it seems unable to move beyond a certain level, and this causes it to experience massive pullbacks between the spikes. But why can’t it move higher?
Enter the triple top pattern, a formation that allows traders to understand when their assets may dip following bullish behavior.
In this guide, we’ll discuss the nuances of the triple top chart pattern, including why this technical analysis pattern occurs, how to identify and trade it, and its benefits and drawbacks.
What is a triple top chart pattern?
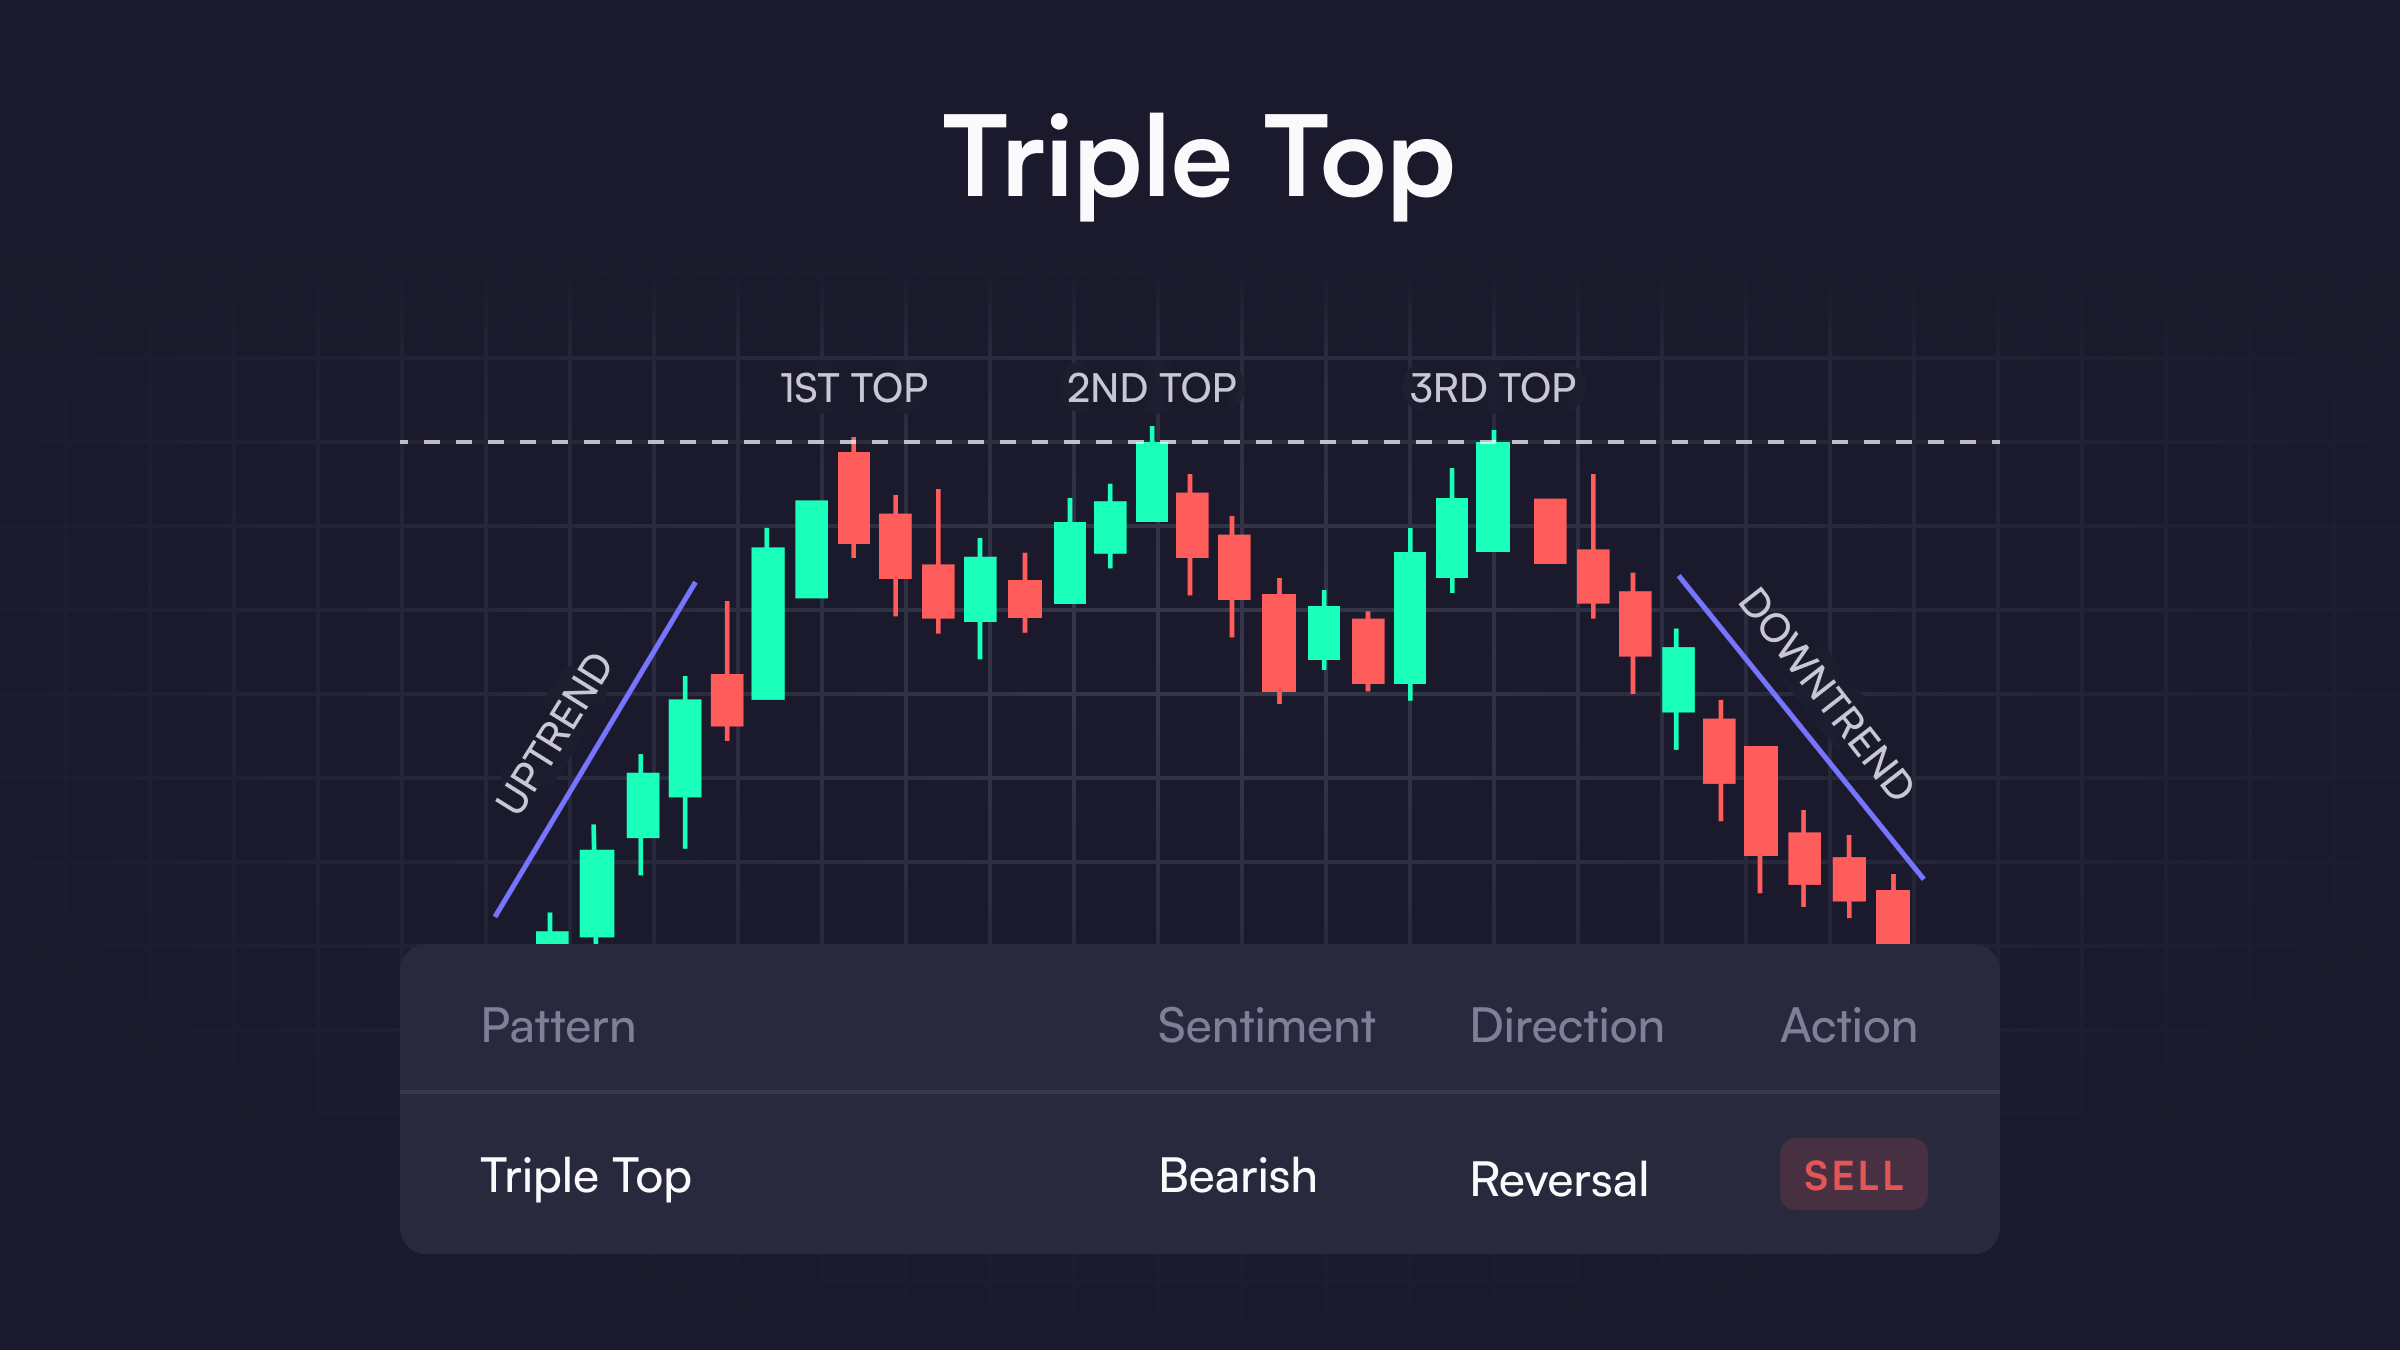
A triple top chart pattern is a bearish technical analysis formation often used in crypto trading and other financial markets. It signals the potential end of an uptrend and the beginning of a downtrend.
The pattern holds significant importance in digital assets due to their volatile nature. This pattern helps traders identify potential reversals in price trends, which is crucial for making informed trading decisions in a market known for rapid price changes.

(Source: Profit and Stocks)
The triple top pattern’s characteristics are defined by three distinct peaks at approximately the same price level, separated by two intervening valleys. These peaks represent strong resistance levels that the asset fails to break through. The pattern is confirmed when the price falls below the support level formed by the lows of the valleys. This breakdown may suggest a shift from bullish to bearish sentiment among market participants. The volume typically diminishes at each peak, indicating decreasing buying pressure. Once confirmed, the pattern can provide insights into potential price targets and risk management strategies.
How to identify a triple top pattern on a crypto chart
A triple top pattern can be identified when an asset’s price rallies three times, yet it faces the same resistance level each period. Whenever asset prices spike, they may be unable move beyond a specific level and fall back until hitting the neckline, which is a figure the downtrend ceases at before another uptrend occurs.
Here’s how to spot a triple top pattern on a crypto chart:
1. Look for three peaks and observe the time duration
The most distinctive feature of the triple top pattern is the presence of three consecutive peaks, which should be at roughly the same price level, indicating that the price has tried and failed to break through a resistance level three times.
Also, the time between each peak should be somewhat consistent, showing a rhythm in the price movement.
2. Check the troughs
Between each peak, there should be a trough or a pullback in price, forming two valleys. The price level of these troughs forms the pattern’s support line, which is crucial to confirm the pattern.
3. Observe the trading volume
In a classic triple top pattern, the volume is typically higher during the first peak’s formation and decreases with each subsequent peak. Decreasing volume can indicate weakening buying pressure.
4. Look out for support line breakdown
A critical confirmation of the triple top pattern occurs when the price breaks below the support line formed by the troughs. This breakdown signifies a shift from a bullish to a bearish trend in the triple top.
5. Confirm pattern and duration
Green flag the pattern once the price closes below the support level. While the pattern’s duration can vary in various financial markets, it generally spans a few weeks to several months in cryptocurrency.
6. Use other tools
To increase the reliability of your analysis, use other technical analysis tools and indicators––like moving averages, relative strength index (RSI), and moving average convergence divergence (MACD)––in conjunction with the triple top pattern.
How to trade a triple top pattern in crypto
Whether trading crypto, a triple top pattern helps traders capitalize on potential trend reversals. Understanding how to effectively trade this pattern can be instrumental in maximizing profits and minimizing risks. Here’s how to trade during a triple top pattern:
Confirmation
Before trading, confirm a triple top pattern, which occurs when the price falls below the support level (the lowest point between the peaks). A premature entry before this confirmation can lead to false signals.
Entry point
Once confirmed, consider entering a short position. The ideal entry point is often just after the price breaks below the support level, confirming the bearish reversal.
Volume check
Pay attention to the trading volume. A significant increase in volume during the breakdown from the support level adds credibility to the pattern and the likelihood of a sustained downtrend.
Target setting
Traders often set profit targets based on the pattern’s height. By measuring the distance between the resistance level (top of the peaks) and the support level and projecting this downward from the breakdown point, estimate a potential target.
Order placing
To manage risk, set stop-loss orders. A common practice is to place a stop-loss just above the resistance level or the highest peak, which may help limit potential losses if the price unexpectedly reverses and moves upward.
Contextual analysis
Consider broader market factors like news, market sentiment, and other technical indicators to inform your trading decisions.
Portfolio consideration
Diversification remains key. Even with strong indicators, dedicating a large portion of your portfolio to a single trade based on the triple top pattern can be risky. Balance and risk management are essential.
Continual monitoring
As market conditions change rapidly, constantly monitoring positions is vital to avoid pitfalls.
Benefits of trading a triple top pattern
The triple top pattern offers unique advantages in crypto trading. Below are a few key benefits:
Clear entry and exit points
The pattern provides distinct entry and exit signals. The breakdown below the support level post the third peak serves as a clear entry point for a short position, and the distance from the peaks to the support level can guide setting target exit points.
Better risk management
Triple top aids in effective risk management. By identifying potential trend reversals, traders can set stop-loss orders appropriately, minimizing potential losses if the market moves against their position.
High predictive value
In crypto, trends can be strong but often change rapidly. Here, the pattern signals a strong likelihood of a shift from an uptrend to a downtrend, providing traders an opportunity to position themselves accordingly.
Adaptable across time frames
Traders can identify the pattern across various time frames, from short to long, making it a versatile tool for different trading styles, from day trading to swing trading.
Drawbacks of trading a triple top pattern
While the triple top pattern is a valuable tool in technical analysis, it's not without its drawbacks. Understanding these limitations is crucial for traders to make informed decisions and manage risks effectively. Here are a few key drawbacks:
False signals
One of the primary drawbacks is the risk of false signals or false breakouts. The pattern might appear to be forming, but the price could unexpectedly reverse and invalidate the pattern, leading to potential losses.
Need for confirmation
The pattern requires confirmation when the price breaks below the support level, which can lead to delayed entry and potentially less favorable trade positions. This delay can be particularly critical in the fast-moving crypto market.
Limited by market conditions
The triple top pattern’s effectiveness can be limited by prevailing market conditions. In strong bull markets, for example, what appears to be a triple top formation might simply be a temporary pause before the trend continues upward.
Psychological pressure
The anxiety of waiting for the pattern to fully form and confirm can lead to psychological pressure, potentially resulting in poor decision-making or premature exits from positions.
Discover more crypto trading tips with dYdX Academy
Eligible traders feeling lost in the whirlwind of crypto trading can turn to dYdX Academy to boost their trading strategies. From deciphering bull flag patterns to decoding inverse head and shoulder patterns, traders can read dozens of guides on all things crypto.
dYdX also offers a decentralized trading platform to help eligible traders begin their trading journey. Find out the full details of our products and platform on our official blog, and eligible traders can start trading on dYdX today.
Disclosures
The content of this article (the “Article”) is provided for general informational purposes only. Reference to any specific strategy, technique, product, service, or entity does not constitute an endorsement or recommendation by dYdX Trading Inc., or any affiliate, agent, or representative thereof (“dYdX”). Use of strategies, techniques, products or services referenced in this Article may involve material risks, including the risk of financial losses arising from the volatility, operational loss, or nonconsensual liquidation of digital assets. The content of this Article does not constitute, and should not be considered, construed, or relied upon as, financial advice, legal advice, tax advice, investment advice, or advice of any other nature; and the content of this Article is not an offer, solicitation or call to action to make any investment, or purchase any crypto asset, of any kind. dYdX makes no representation, assurance or guarantee as to the accuracy, completeness, timeliness, suitability, or validity of any information in this Article or any third-party website that may be linked to it. You are solely responsible for conducting independent research, performing due diligence, and/or seeking advice from a professional advisor prior to taking any financial, tax, legal, or investment action.
You may only use the dYdX Services in compliance with the dYdX Terms of Use available here, including the geographic restrictions therein.
Any applicable sponsorship in connection with this Article will be disclosed, and any reference to a sponsor in this Article is for disclosure purposes, or informational in nature, and in any event is not a call to action to make an investment, acquire a service or product, or purchase crypto assets. This Article does not offer the purchase or sale of any financial instruments or related services.
By accessing this Article and taking any action in connection with the information contained in this Article, you agree that dYdX is not responsible, directly or indirectly, for any errors, omissions, or delays related to this Article, or any damage, injury, or loss incurred in connection with use of or reliance on the content of this Article, including any specific strategy, technique, product, service, or entity that may be referenced in the Article.


